Note
Go to the end to download the full example code.
Transfer data between points and cells#
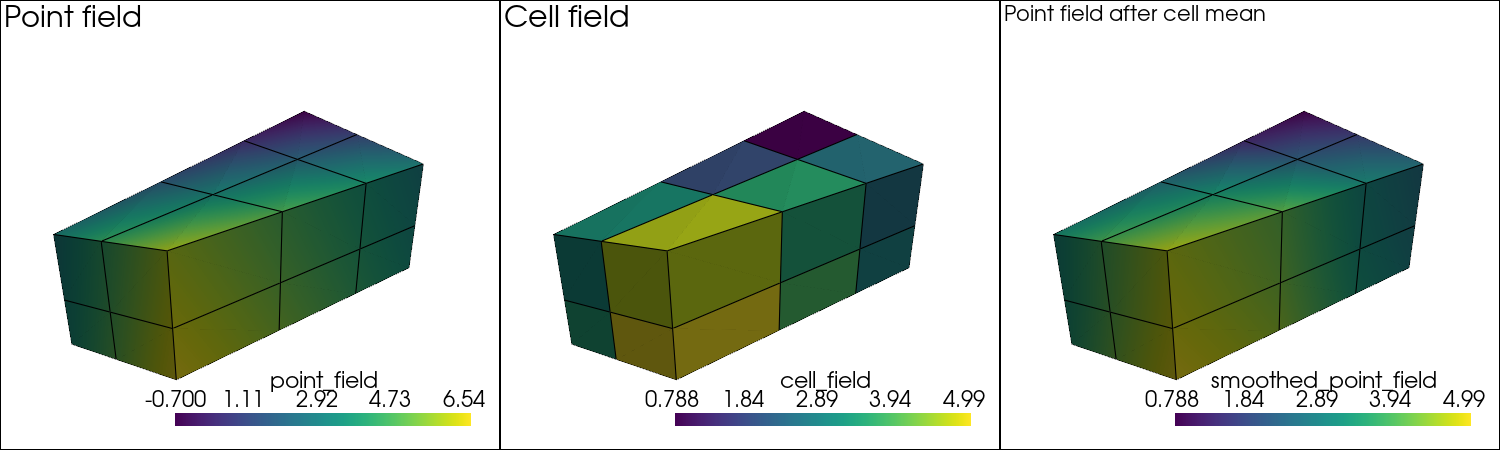
This tutorial starts with a point field, maps it to cells with a mean
reduction, then maps it back to points. It is the shortest introduction to the
point/cell mapping helpers in mesh.topology.
Imports#
import numpy as np
import pyvista as pv

import graphlow
Step 1: Build a small volume mesh#
def make_volume_grid() -> pv.UnstructuredGrid:
    """Create a small warped hexahedral grid."""
    x = np.array([0.0, 1.0, 2.2, 3.5], dtype=np.float32)
    y = np.array([0.0, 0.8, 1.7], dtype=np.float32)
    z = np.array([0.0, 0.6, 1.4], dtype=np.float32)
    X, Y, Z = np.meshgrid(x, y, z, indexing="ij")
    Z = Z + 0.12 * X * Y
    grid = pv.StructuredGrid(X, Y, Z)
    return grid.cast_to_unstructured_grid()
Step 2: Map a point field to cells and back#
def main() -> None:
    """Run the tutorial."""
    mesh = graphlow.from_pyvista(make_volume_grid(), backend="torch")

    point_field = (
        mesh.points[:, [0]]
        + 2.0 * mesh.points[:, [1]]
        - 0.5 * mesh.points[:, [2]]
    )
    cell_field = mesh.topology.map_point_to_cell(
        point_field, mode="mean", method="segment"
    )
    smoothed_point_field = mesh.topology.map_cell_to_point(
        cell_field, mode="mean", method="segment"
    )

    print(f"Point field shape: {tuple(point_field.shape)}")
    print(f"Mapped cell field shape: {tuple(cell_field.shape)}")
    print(f"Mapped-back point field shape: {tuple(smoothed_point_field.shape)}")
    print(f"First five point values: {point_field[:5, 0].tolist()}")
    print(
        "First five mapped-back point values: "
        f"{smoothed_point_field[:5, 0].tolist()}"
    )

    mesh.point_data["point_field"] = point_field
    mesh.cell_data["cell_field"] = cell_field
    mesh.point_data["smoothed_point_field"] = smoothed_point_field
    mesh.copy_features_to_pyvista()

    plotter = pv.Plotter(shape=(1, 3), window_size=[1500, 450])
    plotter.subplot(0, 0)
    plotter.add_text("Point field", font_size=12)
    plotter.add_mesh(mesh.pvmesh, scalars="point_field", show_edges=True)

    plotter.subplot(0, 1)
    plotter.add_text("Cell field", font_size=12)
    plotter.add_mesh(mesh.pvmesh, scalars="cell_field", show_edges=True)

    plotter.subplot(0, 2)
    plotter.add_text("Point field after cell mean", font_size=12)
    plotter.add_mesh(
        mesh.pvmesh,
        scalars="smoothed_point_field",
        show_edges=True,
    )

    plotter.link_views()
    plotter.camera_position = "iso"
    plotter.show()


if __name__ == "__main__":
    main()
/home/runner/work/graphlow/graphlow/src/graphlow/core/topology.py:108: PyVistaDeprecationWarning: `UnstructuredGrid.offset` is deprecated. Use `UnstructuredGrid.cell_offsets` instead.
  return self._mesh.pvmesh.offset
Point field shape: (36, 1)
Mapped cell field shape: (12, 1)
Mapped-back point field shape: (36, 1)
First five point values: [0.0, 1.0, 2.200000047683716, 3.5, 1.600000023841858]
First five mapped-back point values: [1.1379998922348022, 1.674799919128418, 2.8215999603271484, 3.4316000938415527, 1.975250005722046]
Total running time of the script: (0 minutes 0.520 seconds)